It’s a close race, and while Donald Trump’s winning odds are dropping on betting sites, they’re still above Kamala Harris’.
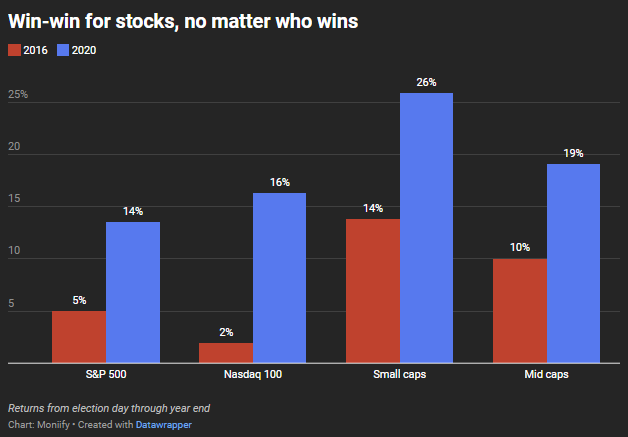
That basically means anything can happen, so brace for some market jitters in the coming days. But the data has a clear message: once the election dust settles, stocks tend to bounce back at year-end, regardless of who takes the W.
We dug into the post-election returns of the S&P 500, the Nasdaq 100, small-caps and mid-caps for the last two US elections, and the trend stays the same: markets get back to business as usual.
The pros agree
Momentum traders are going long on US stocks, the dollar and gold, while keeping bonds on the short side, Bank of America reports. Though it’s worth noting that the bank expects these traders to sell in the coming days if the market falls 1.5% or more.

What history says
- Volatility in the US markets is usually elevated during election years, but it peaks in October before falling back in November and December, as uncertainty around policy starts to fade.
- The fourth quarter is actually historically the strongest for stock returns in election years – a seasonal “Santa Claus” rally tends to come whether it’s an election year or not, according to JP Morgan.
- The last six weeks of the year in election and non-election years have averaged +0.2% weekly returns versus +0.1% for all other weeks.
Over the past nine decades, stock markets have averaged 8% returns in non-election years versus 6.2% in election years, a figure weighed down by 2008’s losses. Excluding that year, election and non-election years actually see similar returns.
Forget this week’s winner and set your sights on the long term. Since 1950, through 18 presidential elections and 10 White House party transitions, US GDP grew at an average annual rate of 3.2%, while the S&P 500 compounded at 9.4% annually, JP Morgan says.
In other words: as you were, folks.
ChatGPT corner


